Quick tip: console logs with conditional breakpoints
When debugging a Javascript program, breakpoints are definitely one of the most useful tool we have. Pausing our app to inspect what's going on inside is a great way to find out what's not working as expected.
There are times, however, when they become a bit tedious to use. Pause, inspect whatever you need, resume, pause again... A couple of times doesn't feel too bad. But whent it's inside a loop going over a fair number of time, I feel it'd be
faster to just let the app run though and console.log whatever I wanted to inspect.
Rather than coming back to my text editor to add the logging instructions in the sources, I'd rather stay in the browser (lazy me ;) ). Especially as this will limit the risk of leaving console.log calls in production code (though this
should be checked by some build tools anyways). If I'm using the Chrome Dev Tools, I'm halfway there. I can edit the JS sources to do the logging, and maybe even try out some code correcting the bug... But this will all be gone when I reload the page and not all devtools allow that.
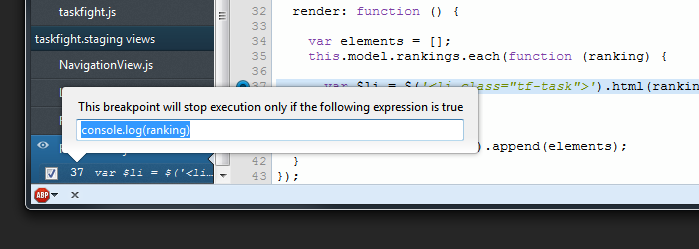
Enter the conditional breakpoints! Browsers dev tools (Chrome, Opera, Firefox,
even IE) allow you to add some code at your breakpoint, and before it pauses the app, run the code to check if it returns true. Any code, even something console.log(mySuperInterestingVariable) (which
returns undefined so won't pause execution).
So there it is: adding logging, without leaving the browser, without modifiying the sources, and staying there when the page is reloaded.
Thanks for reading, I hope this'll prove useful to you. Happy coding :)